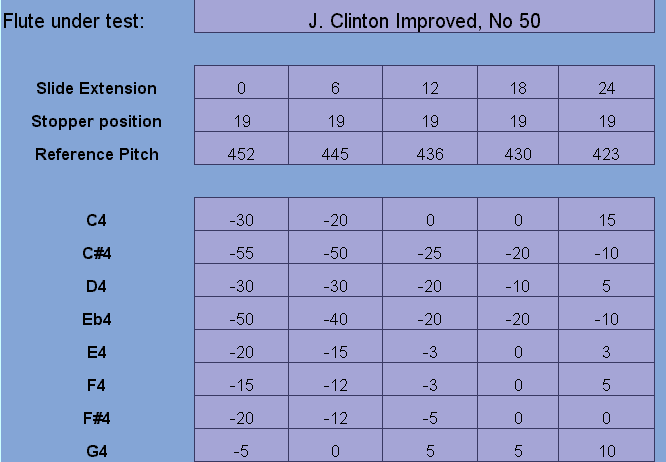
Determining Best PitchThis is advanced notice of a system to assist the flute researcher in determining the pitch at which a flute plays most in tune. It will be revised when the system has been tested on a wider range of instruments. IntroductionUnderstanding old flutes requires, among other things, reaching an understanding of what pitch the flute was intended to play at and how well it does that. This involves taking detailed pitch measurements at a range of slide extensions, and one is soon confronted with a mass of confusing data. The system to be outlined acts to analyse the data and present it in a more easily understandable way. Intended PitchIdeally, historical sources would reveal the intended pitch, but this is not always the case. At various times more than one pitch operated in a region and a period - in this situation was the flute in question intended to operate best at one of them, or to attempt to achieve both equally, or to favour one more than the other? Historical accounts are also often vague or contradictory, or in some notable cases, purposefully misleading. Best PitchWe need to define what we mean by best pitch. It isn't best performance. For understandable physical reasons, a flute almost always plays best when the slide is reduced to its shortest length. In this context, best pitch means the pitch at which the flute's intonation is closest to ideal. Now of course we have to define ideal! In the time and place where my work lies, the 19th century in England, we can safely assume (for the moment at least) that equal temperament or something sufficiently close to it was the aim. Keyboard tuning systems from before the start of the century have most notes within a few cents of Equal. As will be seen from the graphs below, it's not a few cents we are worried about - the flute deviations can be an order of magnitude larger! I say "for the moment" as I don't wish to dismiss the question of temperament out of hand. But the close look needed for signs of temperaments at play will require getting a lot of bigger questions out of the way first. Researchers into earlier flute systems will have differing views of Ideal. That need not prevent a system such as the one I'm about to outline from being of value to them. It would though require interpretation or modification. About the case studyThe worked examples I'm about to present come from a flute under active research at the moment, John Clinton's Improved, as exhibited at the Crystal Palace Exhibition in 1851. Historically it comes after C. Nicholson's Improved, Boehm's 1832 conical, Siccama's Diatonic, and immediately after and in reaction to Boehm's 1847 cylindrical. It comes before R.S. Pratten's Perfected, and the range of heavily keyed cylindrical flutes by Carte, Radcliffe, etc. For more on this instrument. About the analysis systemThe system I am describing is an Excel spreadsheet application. It can be downloaded from further down this page. Instructions pageA rough set of instructions has been prepared for the spreadsheet application and can be selected by clicking the Instructions tab. Data entry pageA data page on the spreadsheet invites you to enter data about the instrument, including identification. Any set of 5 slide extensions can be nominated (overwrite the default extensions). The stopper position is also noted for the record. (Ideally, the stopper position should be altered for each extension of the slide. It is not clear at this stage how this should best be done. My initial feelings are to leave the stopper at the nominal position (1 bore diameter back from the embouchure centre) until further work unearths or suggests an effective regime for setting the stopper.) For each slide position, a reference pitch must be entered. This is the reference pitch of the tuning meter, and can be any convenient note (eg the pitch of A4 - A in the low octave - at that particular extension). From that point on, all measurements in that column are taken relative to that pitch. Further, the player constantly checks the reference note and modifies embouchure position as necessary to maintain correct pitch of the reference note. This provides some control over changed embouchure positions, warming of the flute, and other variables.
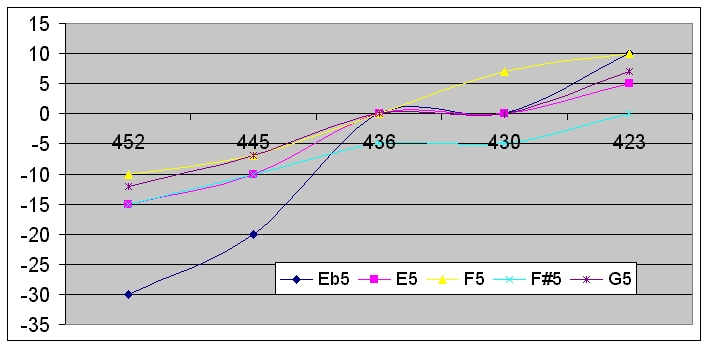
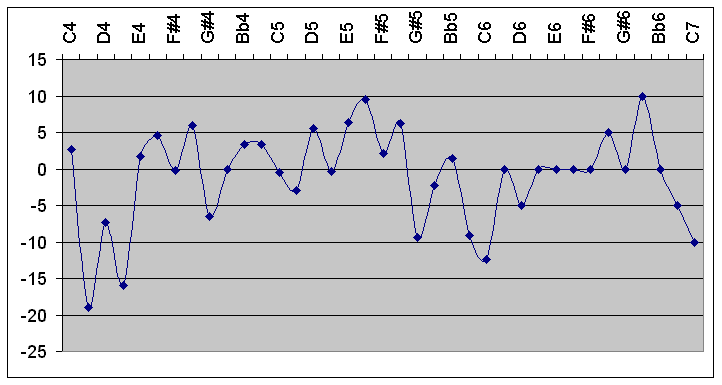
Although not shown in the excerpt above, the table requests a reading of each chromatic note between low C (C4) and the third C (C6). Third octave notes are currently felt to be too highly fingering dependant to be useful in determining best pitch. That will be reviewed in the light of more experience. Review PageThe data entered now appears in graphical form on the Review Page, permitting the operator to look for suspicious data points. Because there are 25 data elements, a single graph would get too cluttered, so the data is broken down into 5 graphs of five data points each. One of these is pictured here:
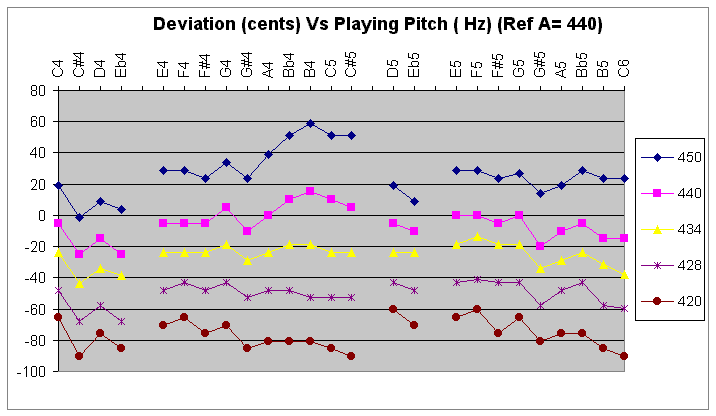
You will note that the deviation of most of the notes progresses smoothly across the graph, inspiring confidence in the data collection process. Variation of +/- 5 cents is about as good as you can expect. Note the response of Eb5 at 436 Hz however. That seems unlikely and would definitely repay checking. Calculations PageOnce the information requested has been entered and saved, a calculations page does the necessary number crunching to massage the data. No operator action is permitted on this page. Pitch PageWe can turn to the Pitch page, where the data is interpreted in a number of graphs. We will take these in turn. Deviation vs. PitchThis graph essentially represents the data entered in graphical form. For improved clarity, the results are presented referenced to A 440 Hz, giving a stack of separate traces rather than a conglomeration of overlapping ones. Breaks in each trace are also introduced to separate the foot, lower octave, mid foot and second octave notes.
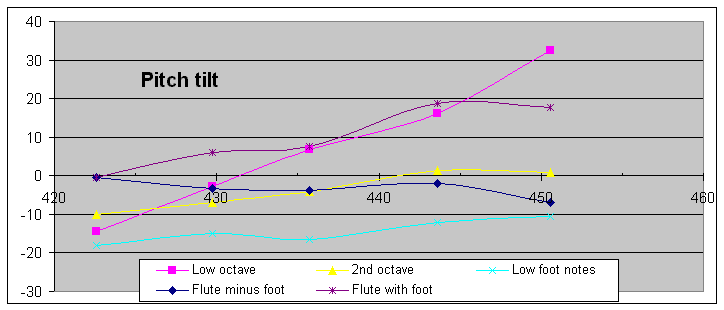
Note that flat foot syndrome is immediately evident (notes C4 to Eb4 being substantially flat compared to the remainder of the flute). Further, we can see that at the highest pitch (450 Hz, no slide extension), the lower octave exhibits substantial tilt, the second octave is generally flat compared to it, and the mid-foot notes cause substantial discontinuities at the break. These are some of the indicators we will be looking at more closely soon. This graph provides a further opportunity to pick up data capture anomalies for retest. One shouldn't become paranoid however - it is impossible to get such data perfectly right, and not essential to our purpose. Best-Pitch IndicatorsAs can be seen, the data still presents a difficult picture to interpret, even in graphical form (and this is a reasonably clear-cut case!). With flutes with greater deviations from note-to-adjacent-note, it becomes much harder to interpret. We need some help and that's what the spreadsheet is designed to do. But first, we have to come up with some indicators of best pitch. Pitch TiltOur first set of indicators I've called Pitch Tilt. When a flute head is shortened, notes at the top of the tube go sharper more than those at the bottom of the tube. Compare the tilt of the blue and brown lines in the Deviation graph between E4 and C#5. In theory then, a flute will be extended to the ideal pitch when no tilt it noticeable. Our next graph illustrates that. It also illustrates that this still isn't the final answer. The pink curve shows that the low octave of the flute would be happiest at 432 Hz (where it crosses the zero-tilt line), but the second octave tilt suggests 442 would be better. Note that tilt is more noticeable in the lower octave - other effects of moving the slide are kicking in in the second octave.
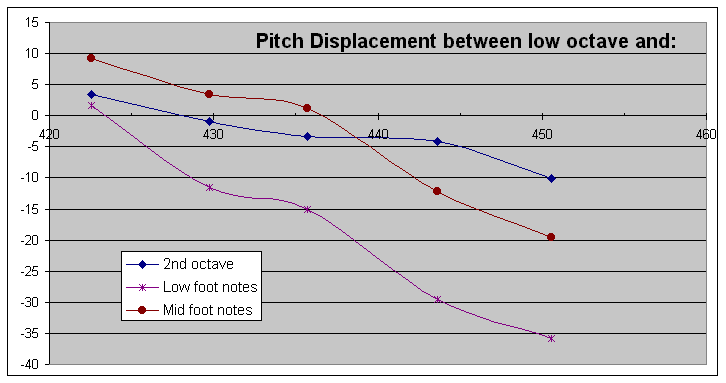
Indeed, tilt in other parts of the flute appears not to offer helpful indicators, at least on this flute. I'm leaving them in for the moment in case another instrument shows different results. Pitch DisplacementOur next set of indicators is pitch displacement - the difference between the average of low octave pitches and the averages in other parts of the range.
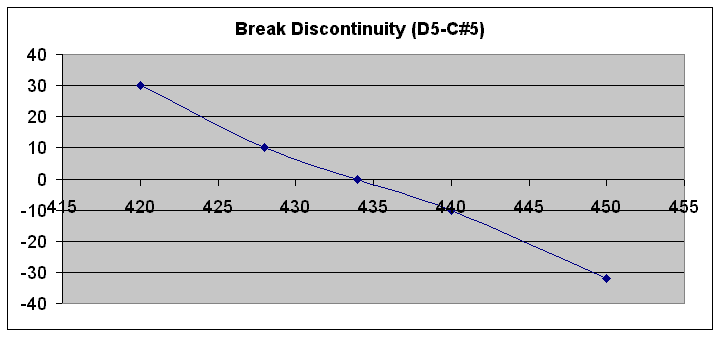
On this flute we can see that the average pitch of the first and second octaves agree best around 428 Hz. The mid foot notes (D5 and Eb5) are happier with 437, and the low foot notes 423 Hz. That's another way of saying the flute suffers from flat foot syndrome. Break DiscontinuityOur next indicator is discontinuity over the octave break. This is a central part of the flute range and continuity of pitch through this region is therefore important to the overall useability of the instrument. As examination of the Deviation graph illustrates, the foot notes are not so affected by slide extension as the upper tube notes, leading to rapidly increasing discontinuities as the slide passes through the optimum position.
Sum of absolute deviationsOur final indicator is to take the sum of the absolute values of all the deviations. This works very well when the flute is pretty accurate from note to adjacent note, but can be obscured when the "statutory" deviations are great. This curve also gives us a feel for how good the flute is at its best, and how much worse elsewhere.
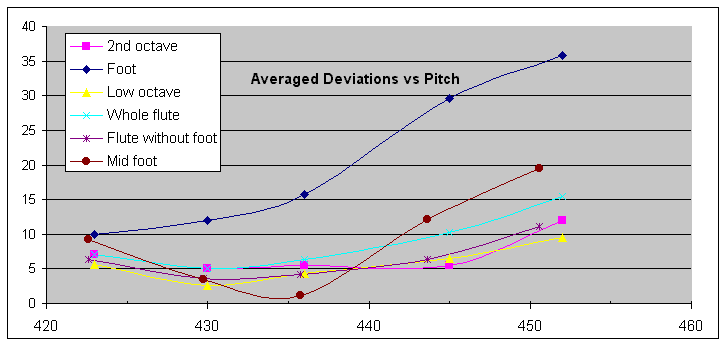
Here we note again the effect of flat foot syndrome - the foot would be moderately happy around 420 Hz and very troublesome indeed at High Pitch (452). The low octave is still plumbing for around 430, the second octave less decisive in the 430 to 445 range. The two mid foot notes would absolutely revel at 435Hz! Average DeviationThis graph is a subtle variation on the one above. It presents the averaged sum of deviations in each section of the flute, giving us perhaps a better idea of how much compensation is going to be needed on most notes in the area.
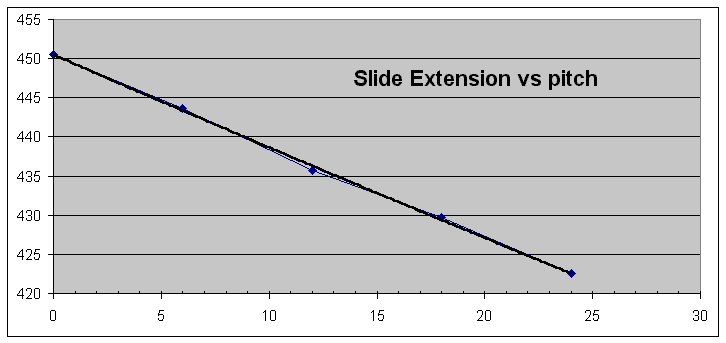
Making a decisionBy now it's clear that the spreadsheet isn't going to make the final decision for you. In the case above, I'd argue for the 430Hz ("Low Pitch") to 435 Hz (Continental Pitch) region as being the design aim. All the indicators seem to agree that the performance at "High Pitch" (452Hz) is far degraded. If we wanted to go a little bolder, we might assert that those several indicators tending towards 440 illustrate some intention to compromise between the two pitches. Not sure if I'm feeling that bold just yet, and the rapidly worsening flat foot remains a powerful argument against going sharper. Pitch vs extensionOne graph remains. It gives the pitch at each extension against how far the head is extended. This particular set of readings seemed to go well, but in any case, a trend-line is provided to iron out the bumps.
Once a decision has been reached about the best pitch, it can be entered into the Test Pitch box at the head of the 3rd Octave page. The spreadsheet calculates the deviation for each note at that pitch. The selected pitch does not need to be one of those tested. Further, because the trend of each note is used in the calculation, the likely accuracy of the result is probably higher than the input data. 3rd Octave notesYou'll remember we chose not to include the 3rd octave in our pitch determining tests. There is a bewildering array of third octave fingerings and no real guidance as to which should work best on a particular flute (this situation may change with more work). The third octave page gives us a place to record the best fingering and deviation of the notes of the third octave, once we have made a decision about the best pitch for the rest of the flute. 3 Octave Averaged ResponseThe calculated result from the first two octaves is combined with the measured result from the third octave as the 3 Octave Averaged Response.
ConclusionThe spreadsheet application described above can assist the researcher to analyse pitch data to illustrate how several parameters in several sections of the flute react with extension of the tuning slide. Taking all reactions together, it becomes easier to identify the pitch which the maker achieved best intonation. Whether that pitch was also the intended operating pitch is a matter that can then be taken up between the flute researcher and the music historians. Work OutstandingI need to test the system on a few more flutes before I can really pronounce it safe for use on the streets. In the meantime, it can be downloaded in Beta form .... Download You may also need a good tuner. I use Tatsuaki Koroda's Auto Tuner, downloadable from http://www1.ocn.ne.jp/~tuner/tuner_e.html. At our request, Tatsuaki has graciously incorporated a number of facilities useful for historic flute research. If you do download and use the system, I'd appreciate a copy of any data you gather. I also need to consider if all the indicators are valid and necessary, and if there are better or other indicators we should use. In this regard I welcome your thoughts. I'd also welcome alternative interpretations of the data presented above. |
